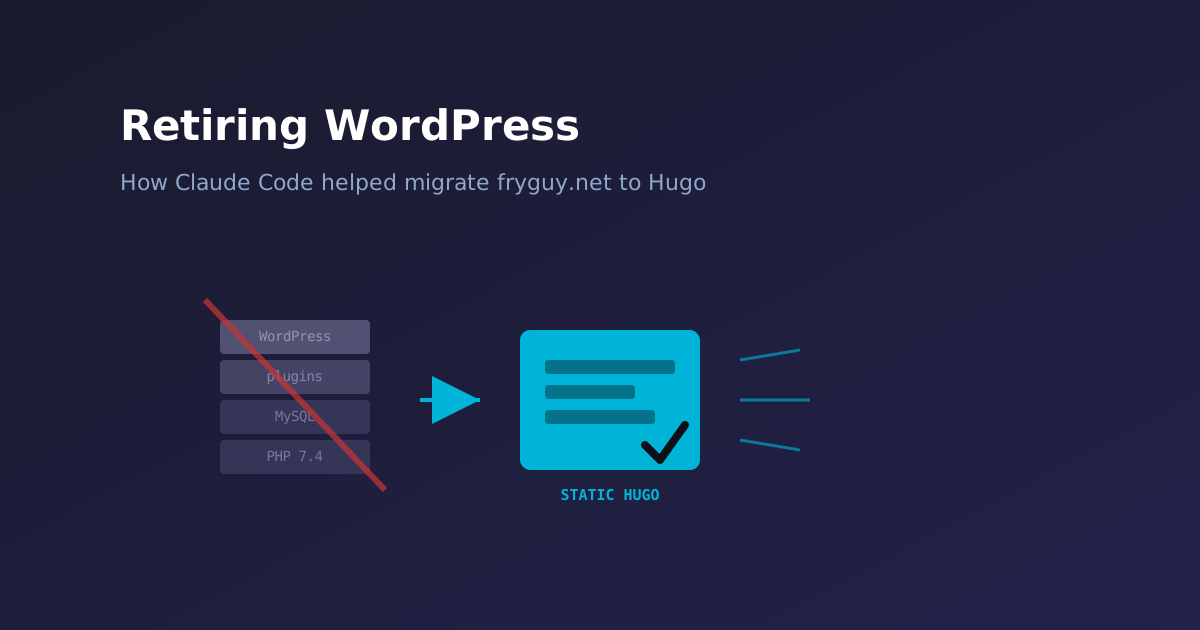
This site has run on WordPress since basically forever. As of this week, it doesn’t anymore. Everything you’re reading is now a static Hugo site, built from Markdown, served by nginx, with no PHP and no database anywhere in the stack. Here’s why I did it, what actually moved, and how I used Claude Code as a pair programmer for most of the heavy lifting.
Why bother
Let’s be honest about how it got this bad: I didn’t keep up with it. I know. Servers don’t rot on their own — you stop patching them, stop upgrading them, and a few years later you’re staring at a stack that’s aged out from under you. The old droplet had quietly rotted underneath a site that still worked fine. Ubuntu 18.04 — EOL since 2023. PHP 7.4 — EOL since 2022, with no apt-upgrade path to anything newer (the PPA I’d have needed was frozen). MySQL 5.7 — also EOL. WordPress itself was current; everything under it wasn’t, and there was no clean patching path left, just a slow accumulation of risk on a box facing the public internet.